A real look
inside the door.
Before you click anything else — here's exactly what you walk into the moment your membership starts. Seven screens, the same ones every Foundation member sees on Day 1.
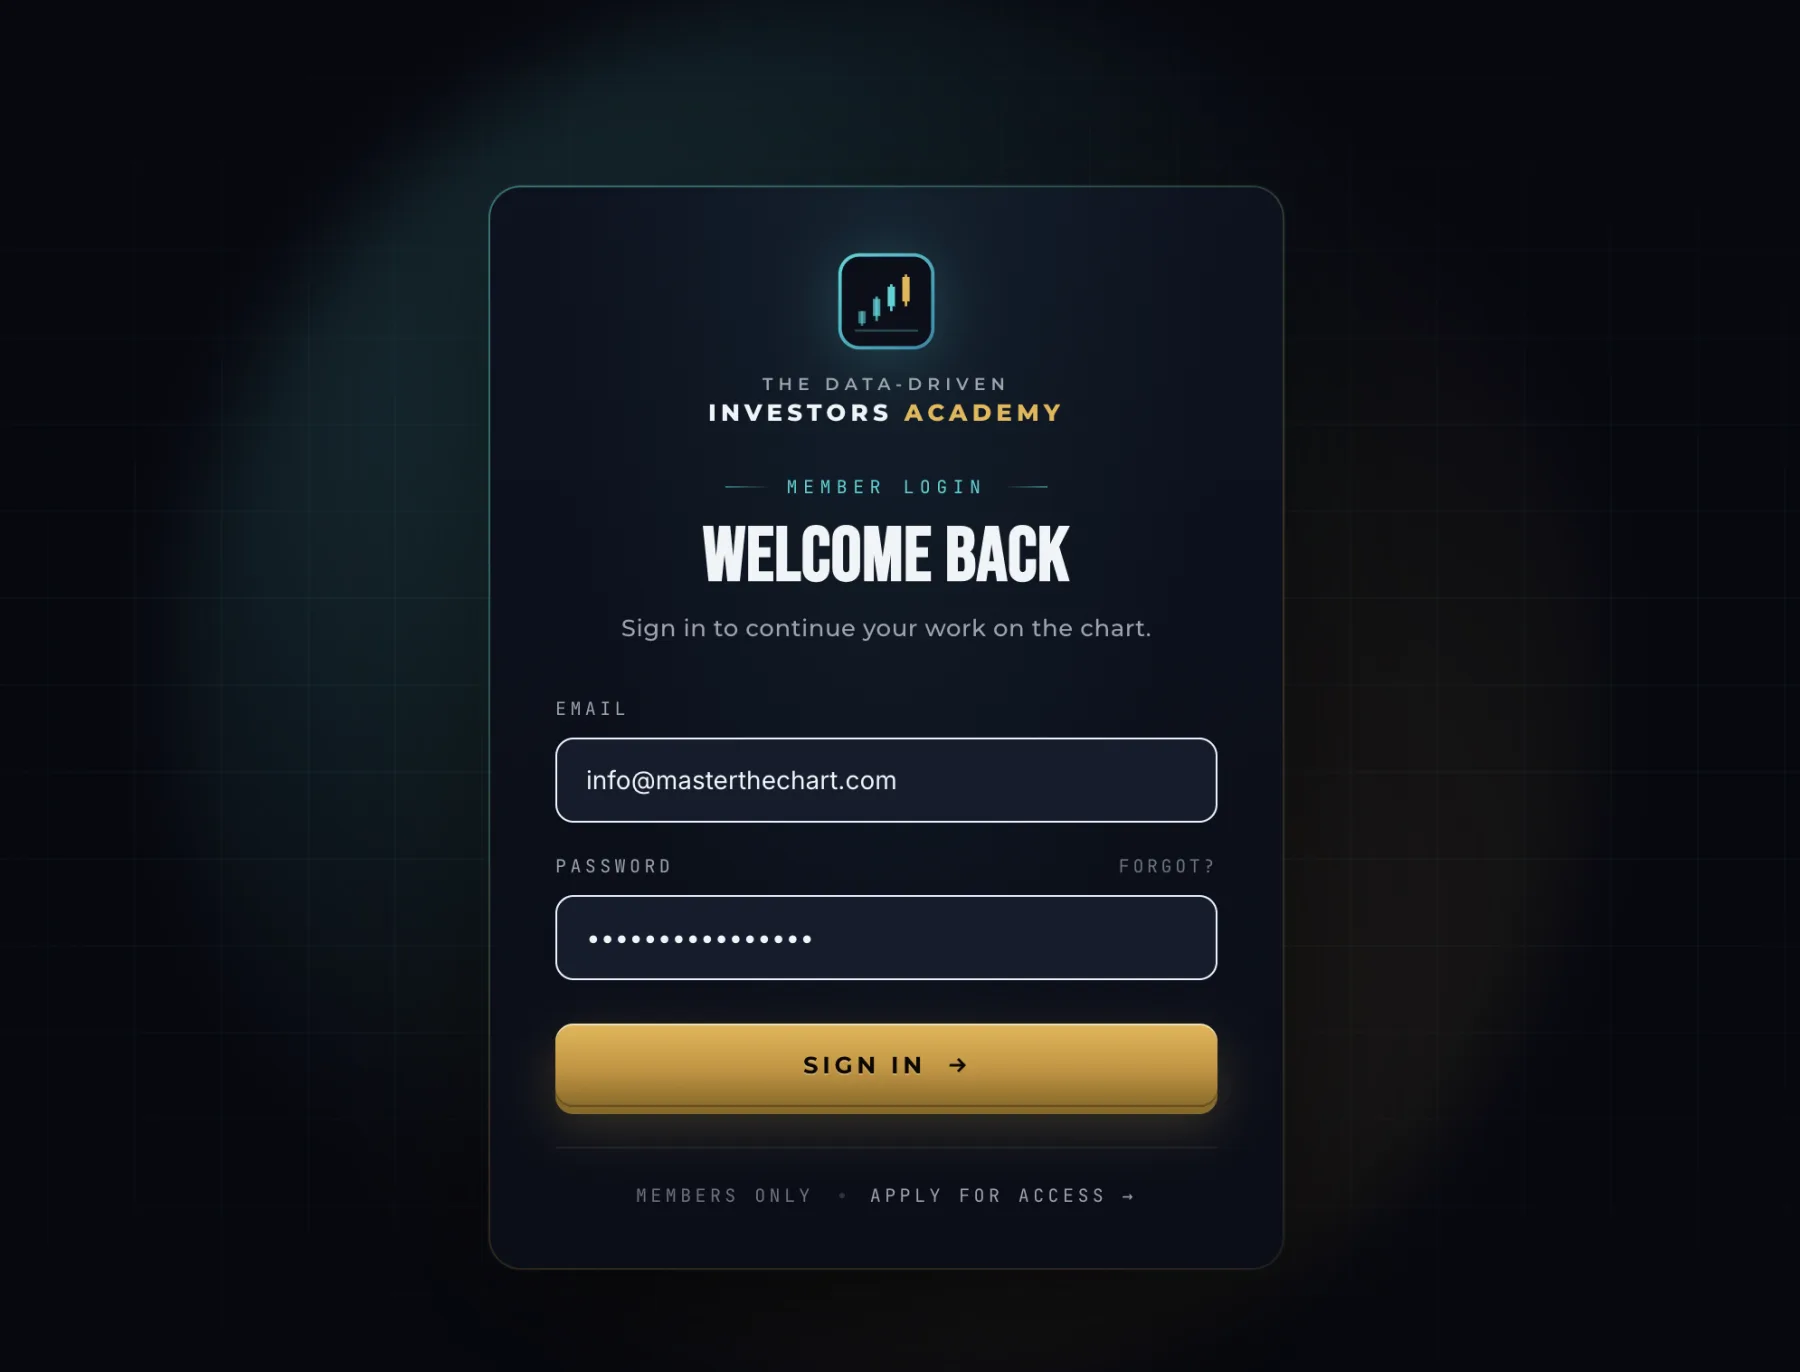
One door. Your front-row seat.
After checkout you land here. Single link, single password, then you're inside. No app to install, no plugin to manage — open it on any device, mid-meeting, mid-flight, mid-coffee.
Hosted at app.masterthechart.com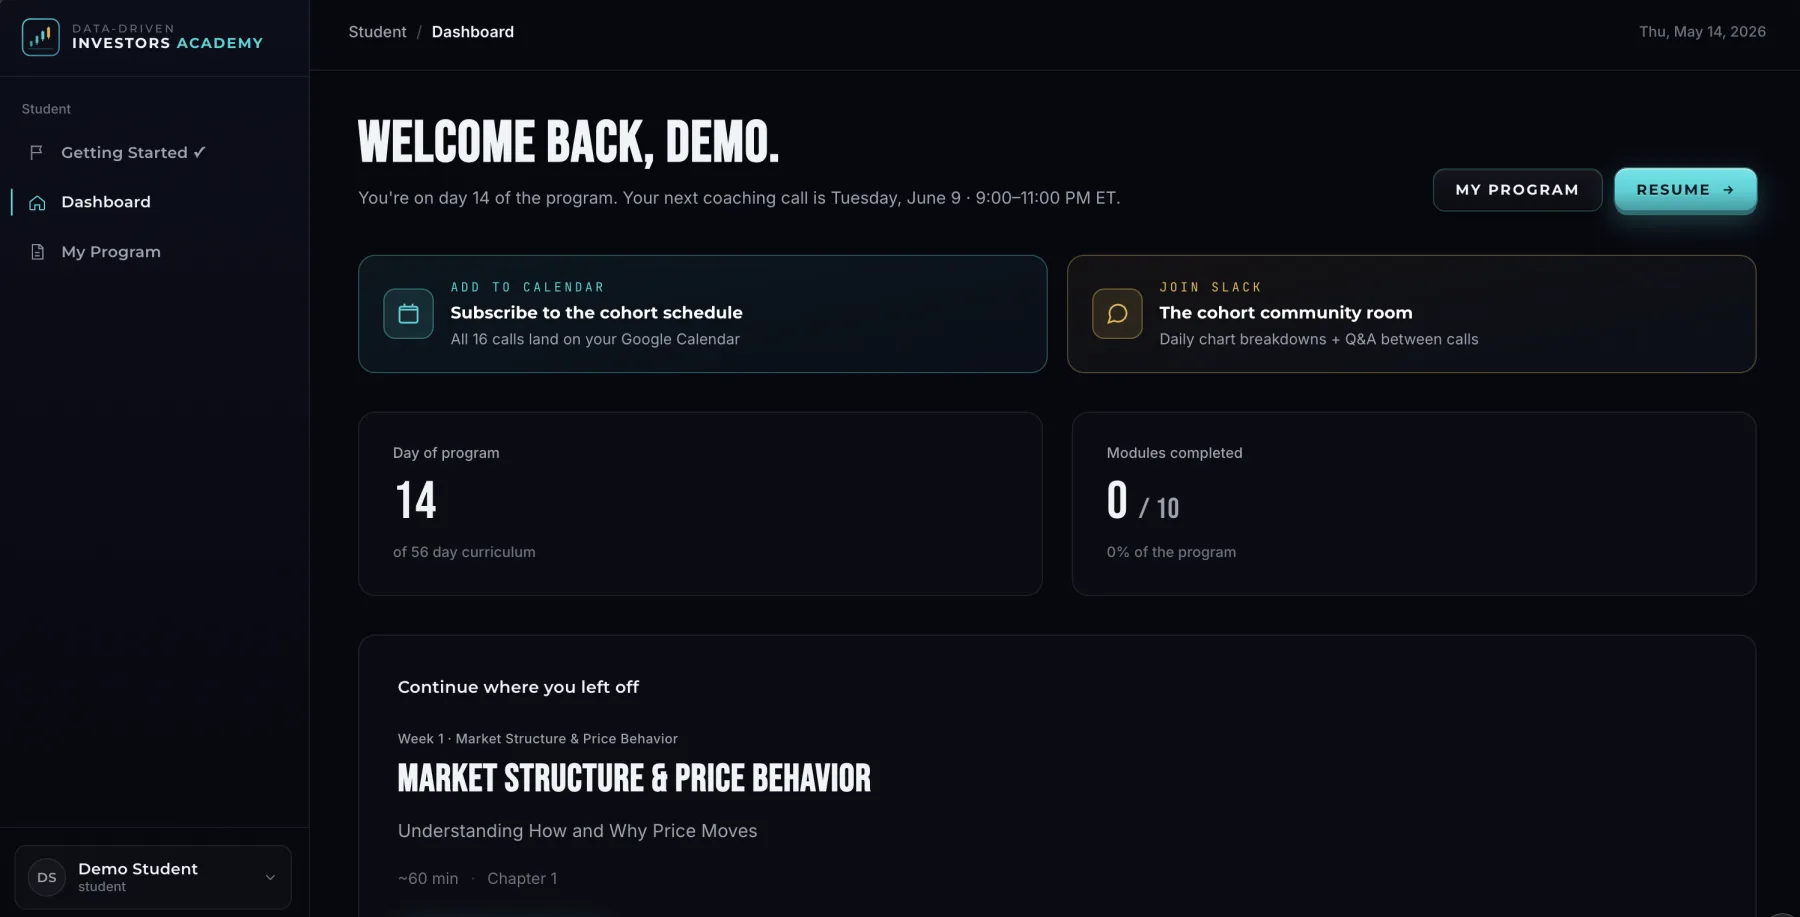
The dashboard,
opening day.
Where you live, week after week. Your progress, the next live call, the next lesson, the playbook, the room — all one screen. No clutter, no upsell — just the work and where you are in it.
Built for clarity, not noise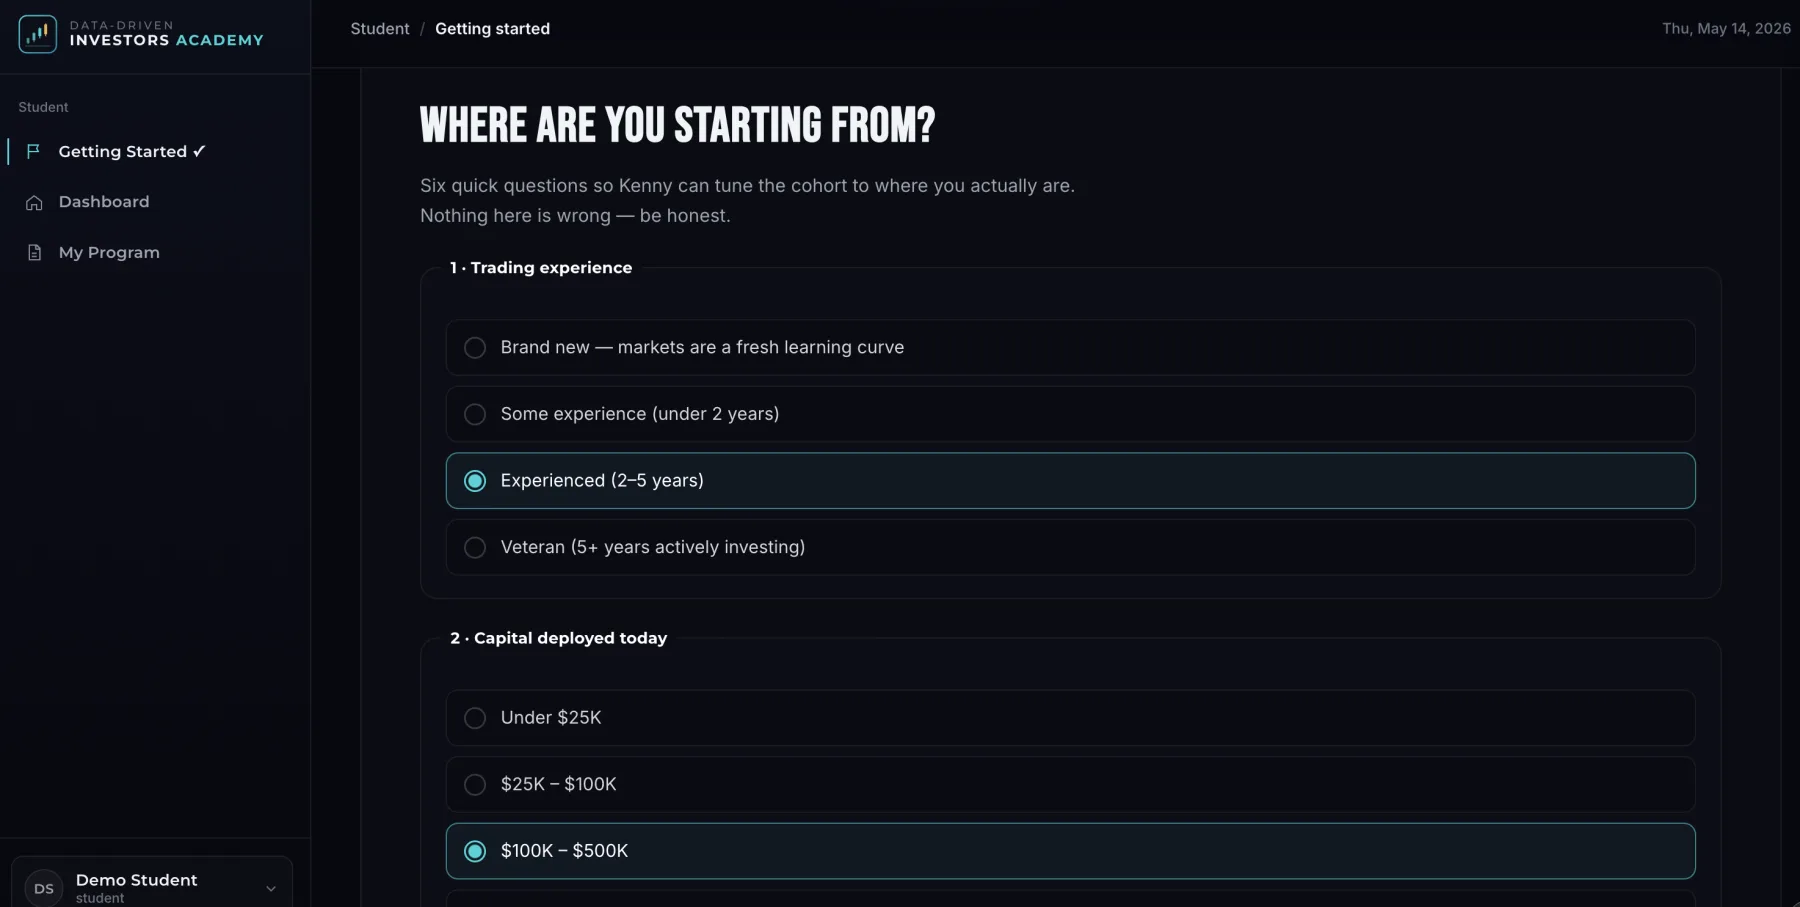
Built around
your goals.
First time in, you tell us where you are and where you want to land. Hours per week, biggest challenge, the outcome you actually came for. Kenny reads every response before Day 1 so the calls land where they need to.
6 questions · ~3 minutes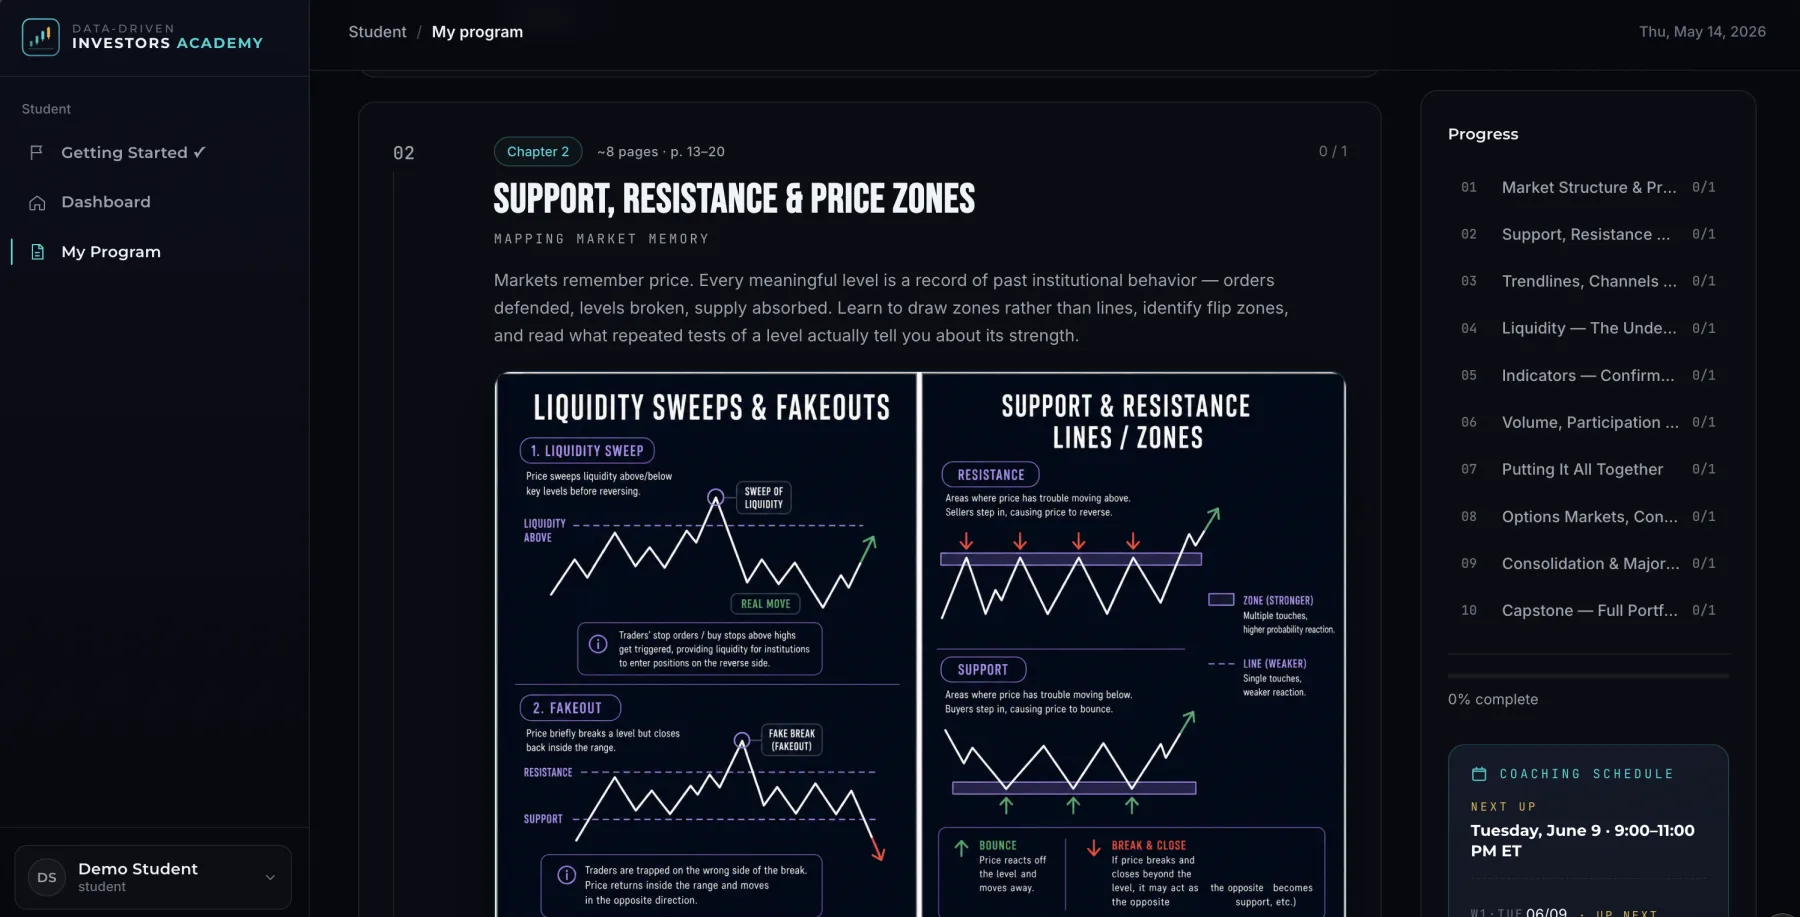
Inside a lesson.
Video, annotated charts, the framework written out, the quiz. Short enough to do before the live call — dense enough to come back to next month when the same pattern shows up on your screen.
10 chapters · Quiz after each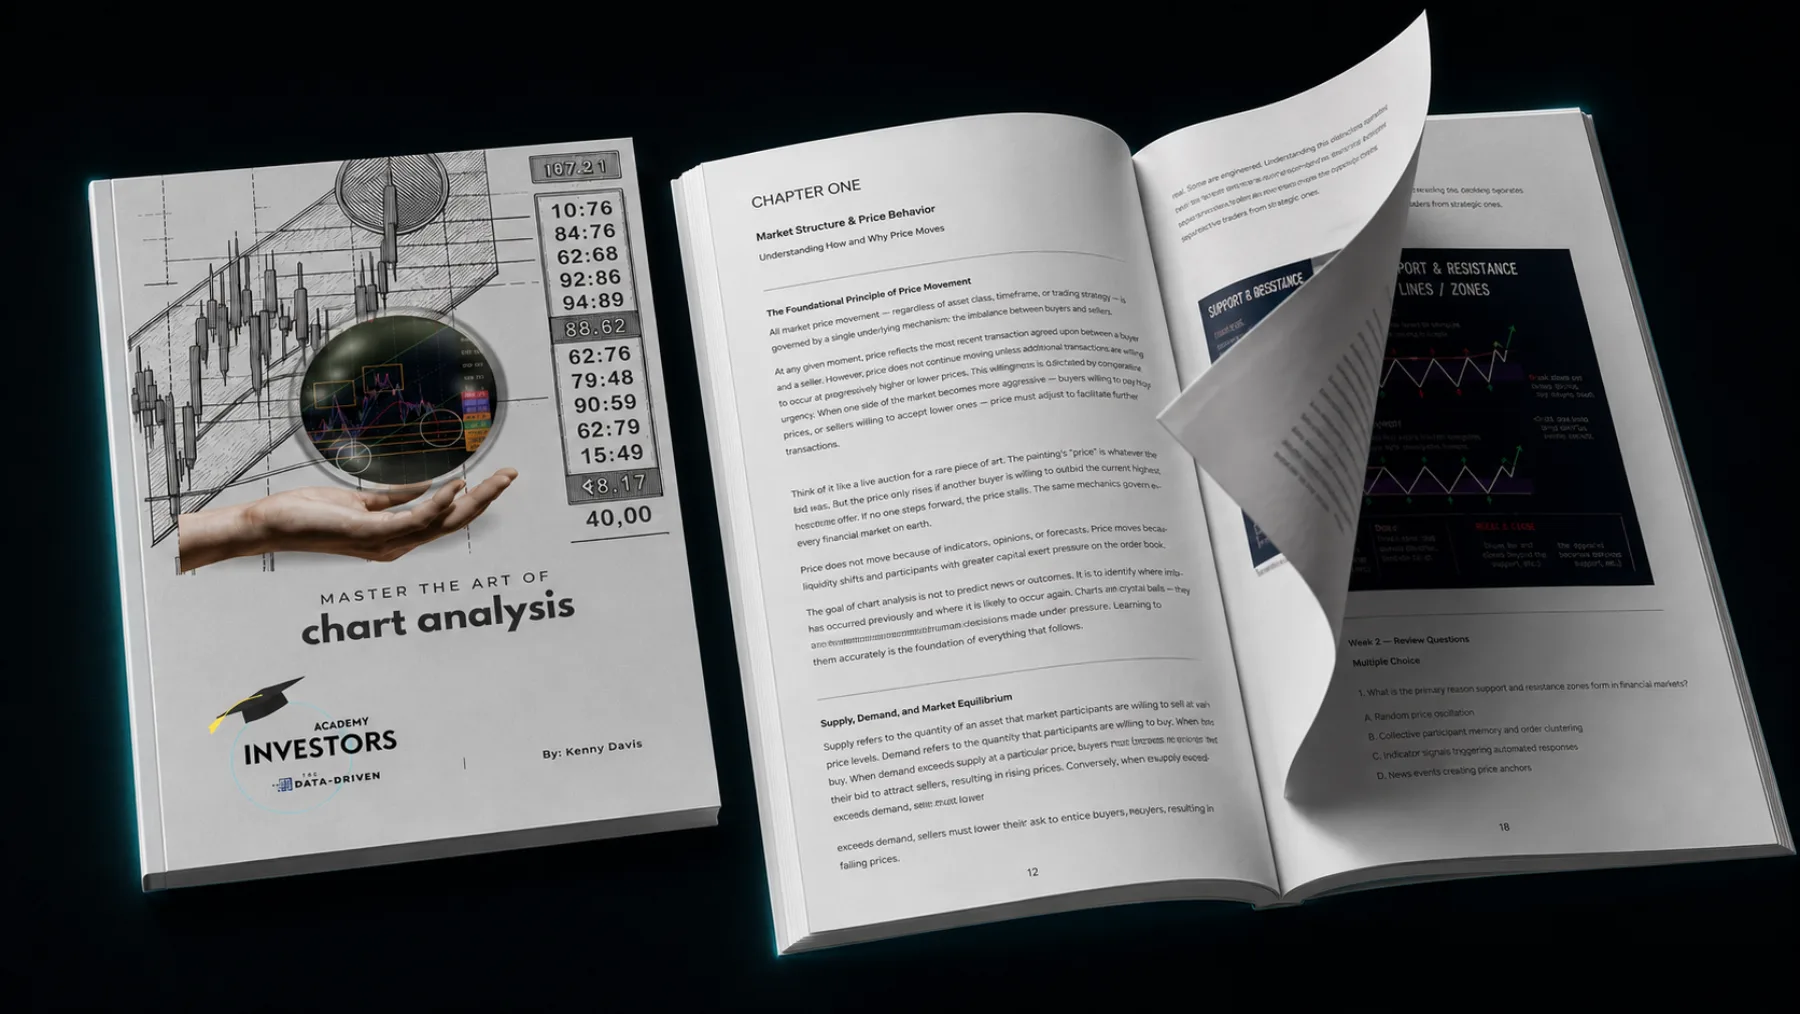
The playbook, in writing.
A printable PDF you keep next to you while you trade. Every framework, every checklist, every rule Kenny teaches — pulled out of the videos and laid out clean. Yours, forever, even if you never re-enroll.
Downloadable · Print-ready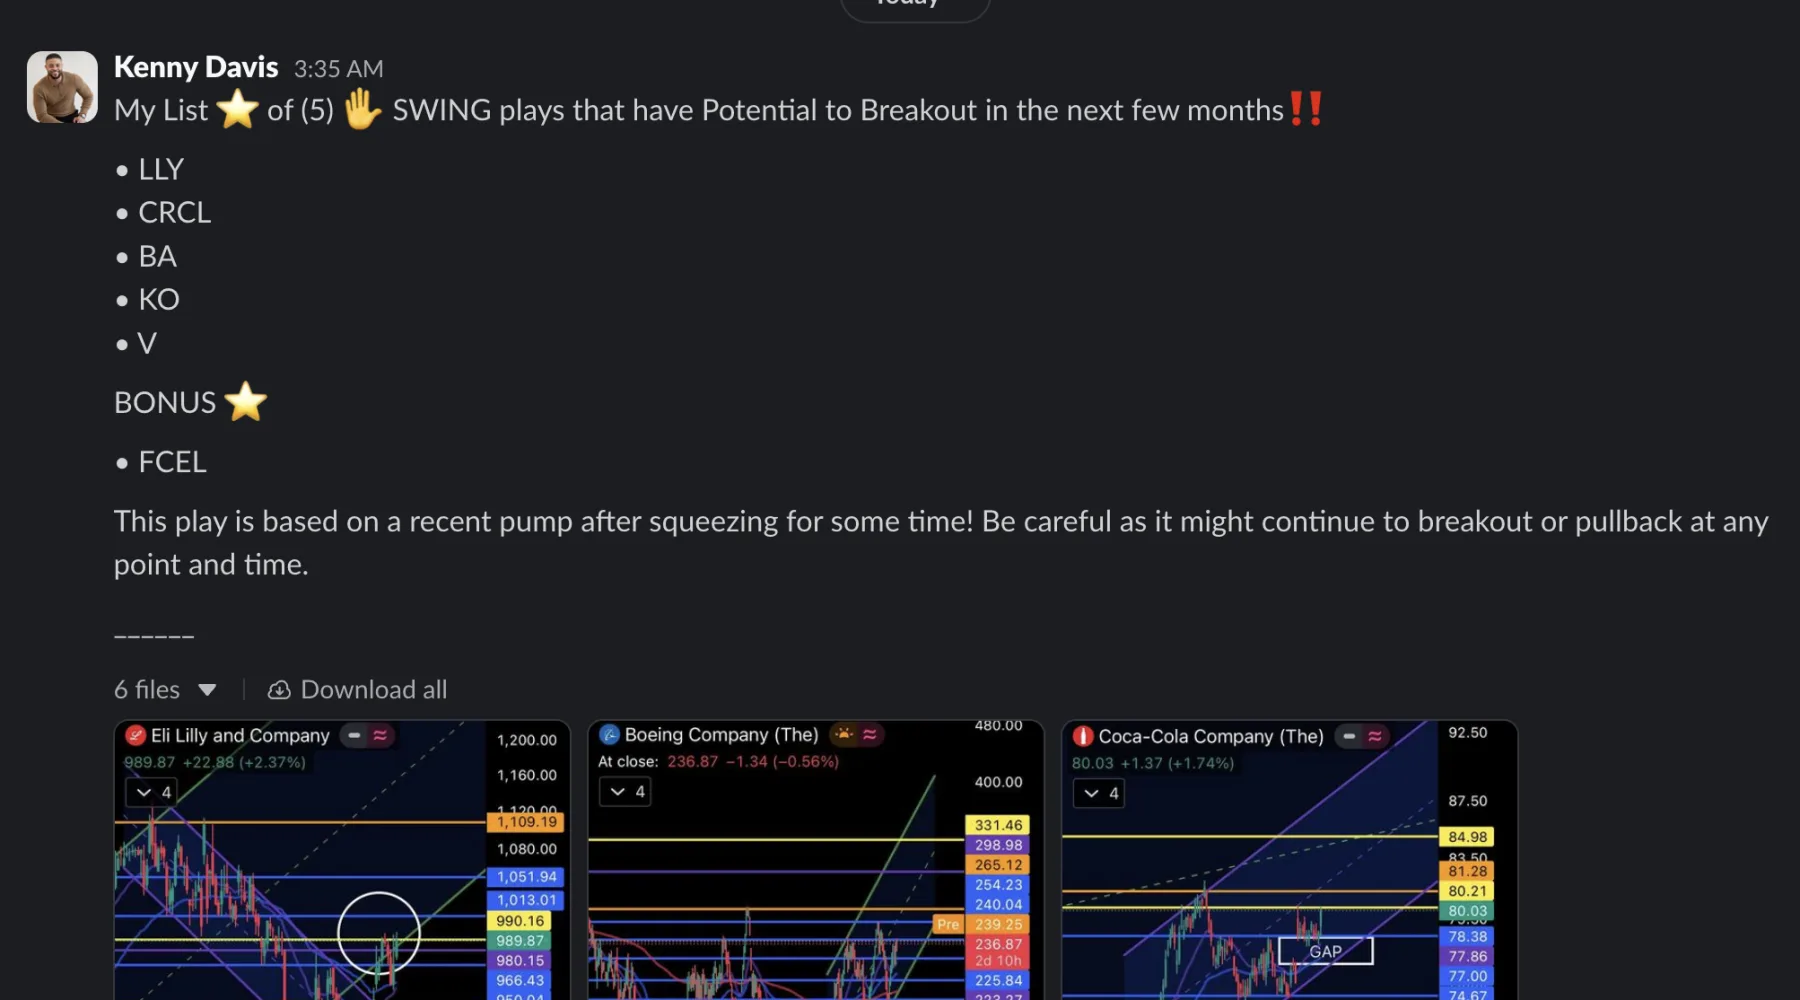
Trades the moment Kenny takes them.
Kenny posts his real entries, exits, and reasoning in the #trades channel. You see the chart he saw, the level he watched, and what he did next. Not a signals service — a window into how a 20-year teacher actually moves.
Members-only · Real-time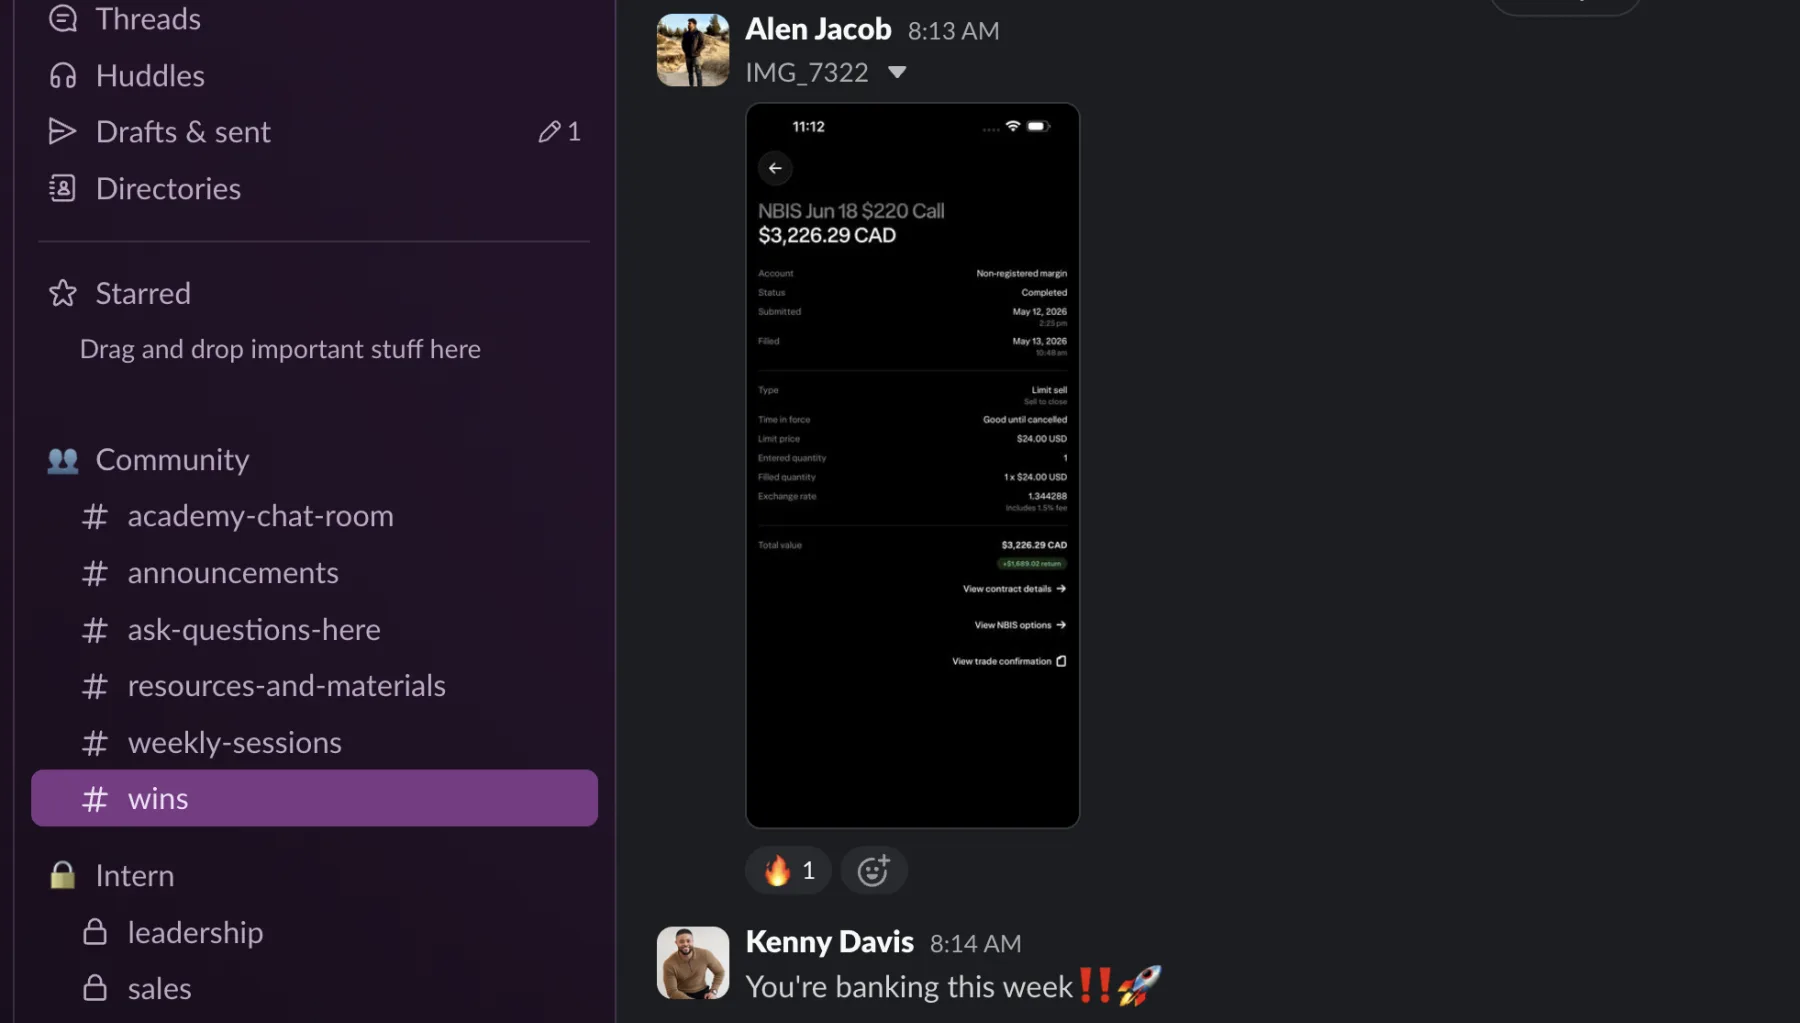
The room where
wins get posted.
A working room of members moving together — posting their reads, their setups, the trades that worked. The energy here is half the reason the work sticks. You're not learning alone, and on the days the chart is hard, the room is what keeps you in the seat.
Members-only · No noise